Reference / Source & method
Built on a remarkable
map of probability.
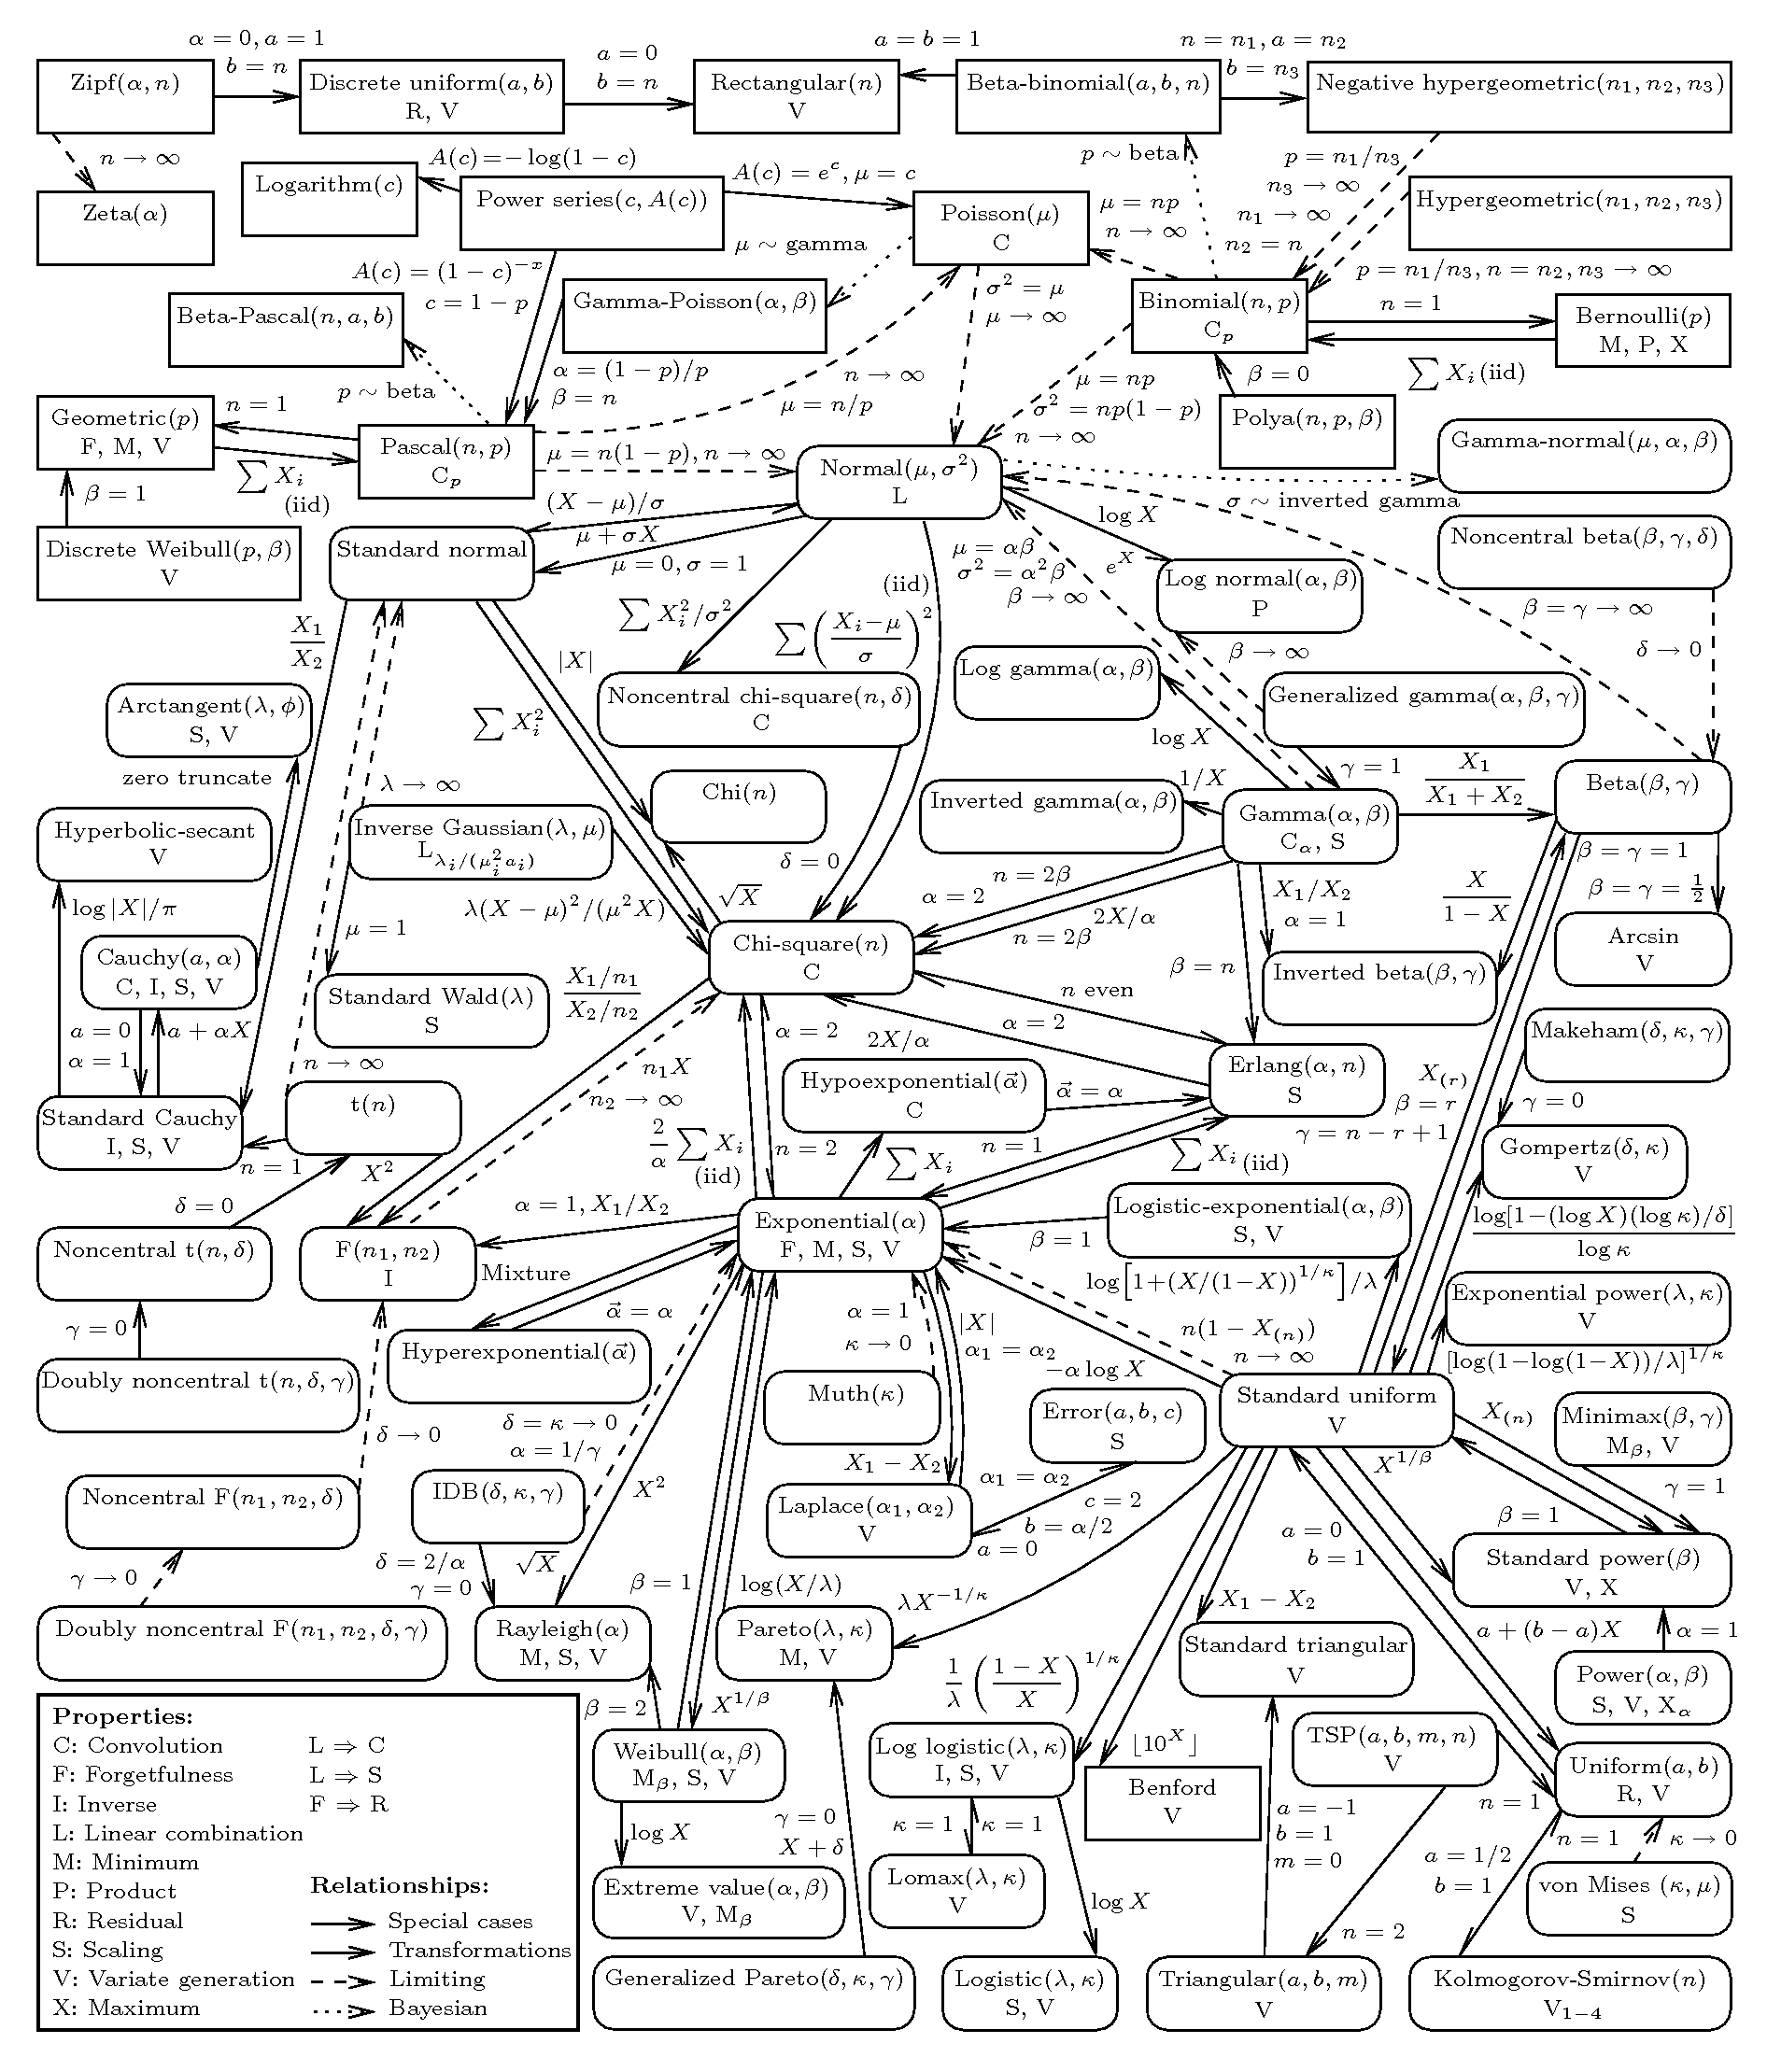
This project interprets the Univariate Distribution Relationship Chart by Lawrence M. Leemis and Jacquelyn T. McQueston, preserving its relationship vocabulary while adding a smaller interactive learning layer.
Provenance
The reference is the Univariate Distribution Relationship Chart hosted by William & Mary. The chart page credits Lawrence M. Leemis and Jacquelyn T. McQueston and links the paper “Univariate Distribution Relationships,” The American Statistician, 62(1), 2008. The downloaded image is retained here for study and attribution; this site’s guided graph and prose are an independent educational interface.
 Open the full-resolution reference ↗
Reading the notation
The source chart uses four arrow styles. Solid arrows identify special cases; paired-line arrows show transformations; dashed arrows encode limiting relationships; dotted arrows indicate Bayesian relationships. Letters inside nodes mark useful properties: C convolution, F forgetfulness, I inverse, L linear combination, M minimum, P product, R residual, S scaling, V variate generation, and X maximum.
Computational method
The playground evaluates probability mass and density functions directly in TypeScript. Gamma-family normalizing constants use a Lanczos approximation to log Γ(x), which keeps products numerically stable across the parameter ranges exposed by the controls. Astro pre-renders every page to static HTML; only the playground and map hydrate as React islands. No observation or parameter value is sent to a server.
Scope
The full poster contains dozens of specialized families and hundreds of relationships. The current computational layer implements fourteen foundational distributions and nineteen high-value connections, while the complete poster remains available beside it. Distribution definitions and relationship records are centralized typed data, so later chapters can reuse them for likelihoods, generalized linear models, priors, sampling, and optimization.