Special cases
A broad family collapses to a familiar one at a particular parameter value. Exponential is Weibull with shape 1; chi-square is gamma with shape k/2 and scale 2. These are identities, not approximations.
Reference / The relationship map
Don’t memorize the catalog.
The original chart encodes hundreds of links. This guided view starts with its central backbone—the relationships that recur constantly in statistics and machine learning.
A broad family collapses to a familiar one at a particular parameter value. Exponential is Weibull with shape 1; chi-square is gamma with shape k/2 and scale 2. These are identities, not approximations.
A deterministic operation on random variables produces another law. Standardizing a normal gives a standard normal; squaring and summing standard normals gives chi-square; applying a quantile function to a uniform variate creates a sample.
A sequence of models approaches another distribution. Sparse binomial counts become Poisson, large Poisson counts become normal, and Student t becomes normal as its degrees of freedom grow.
A prior and likelihood share an algebraic shape, so updating preserves the family. A Beta prior paired with Bernoulli or binomial data yields a Beta posterior by simply adding counts.
Explore the source
Pan, zoom, search, and select every distribution on the original chart. Foundational nodes jump directly into the computational playground.
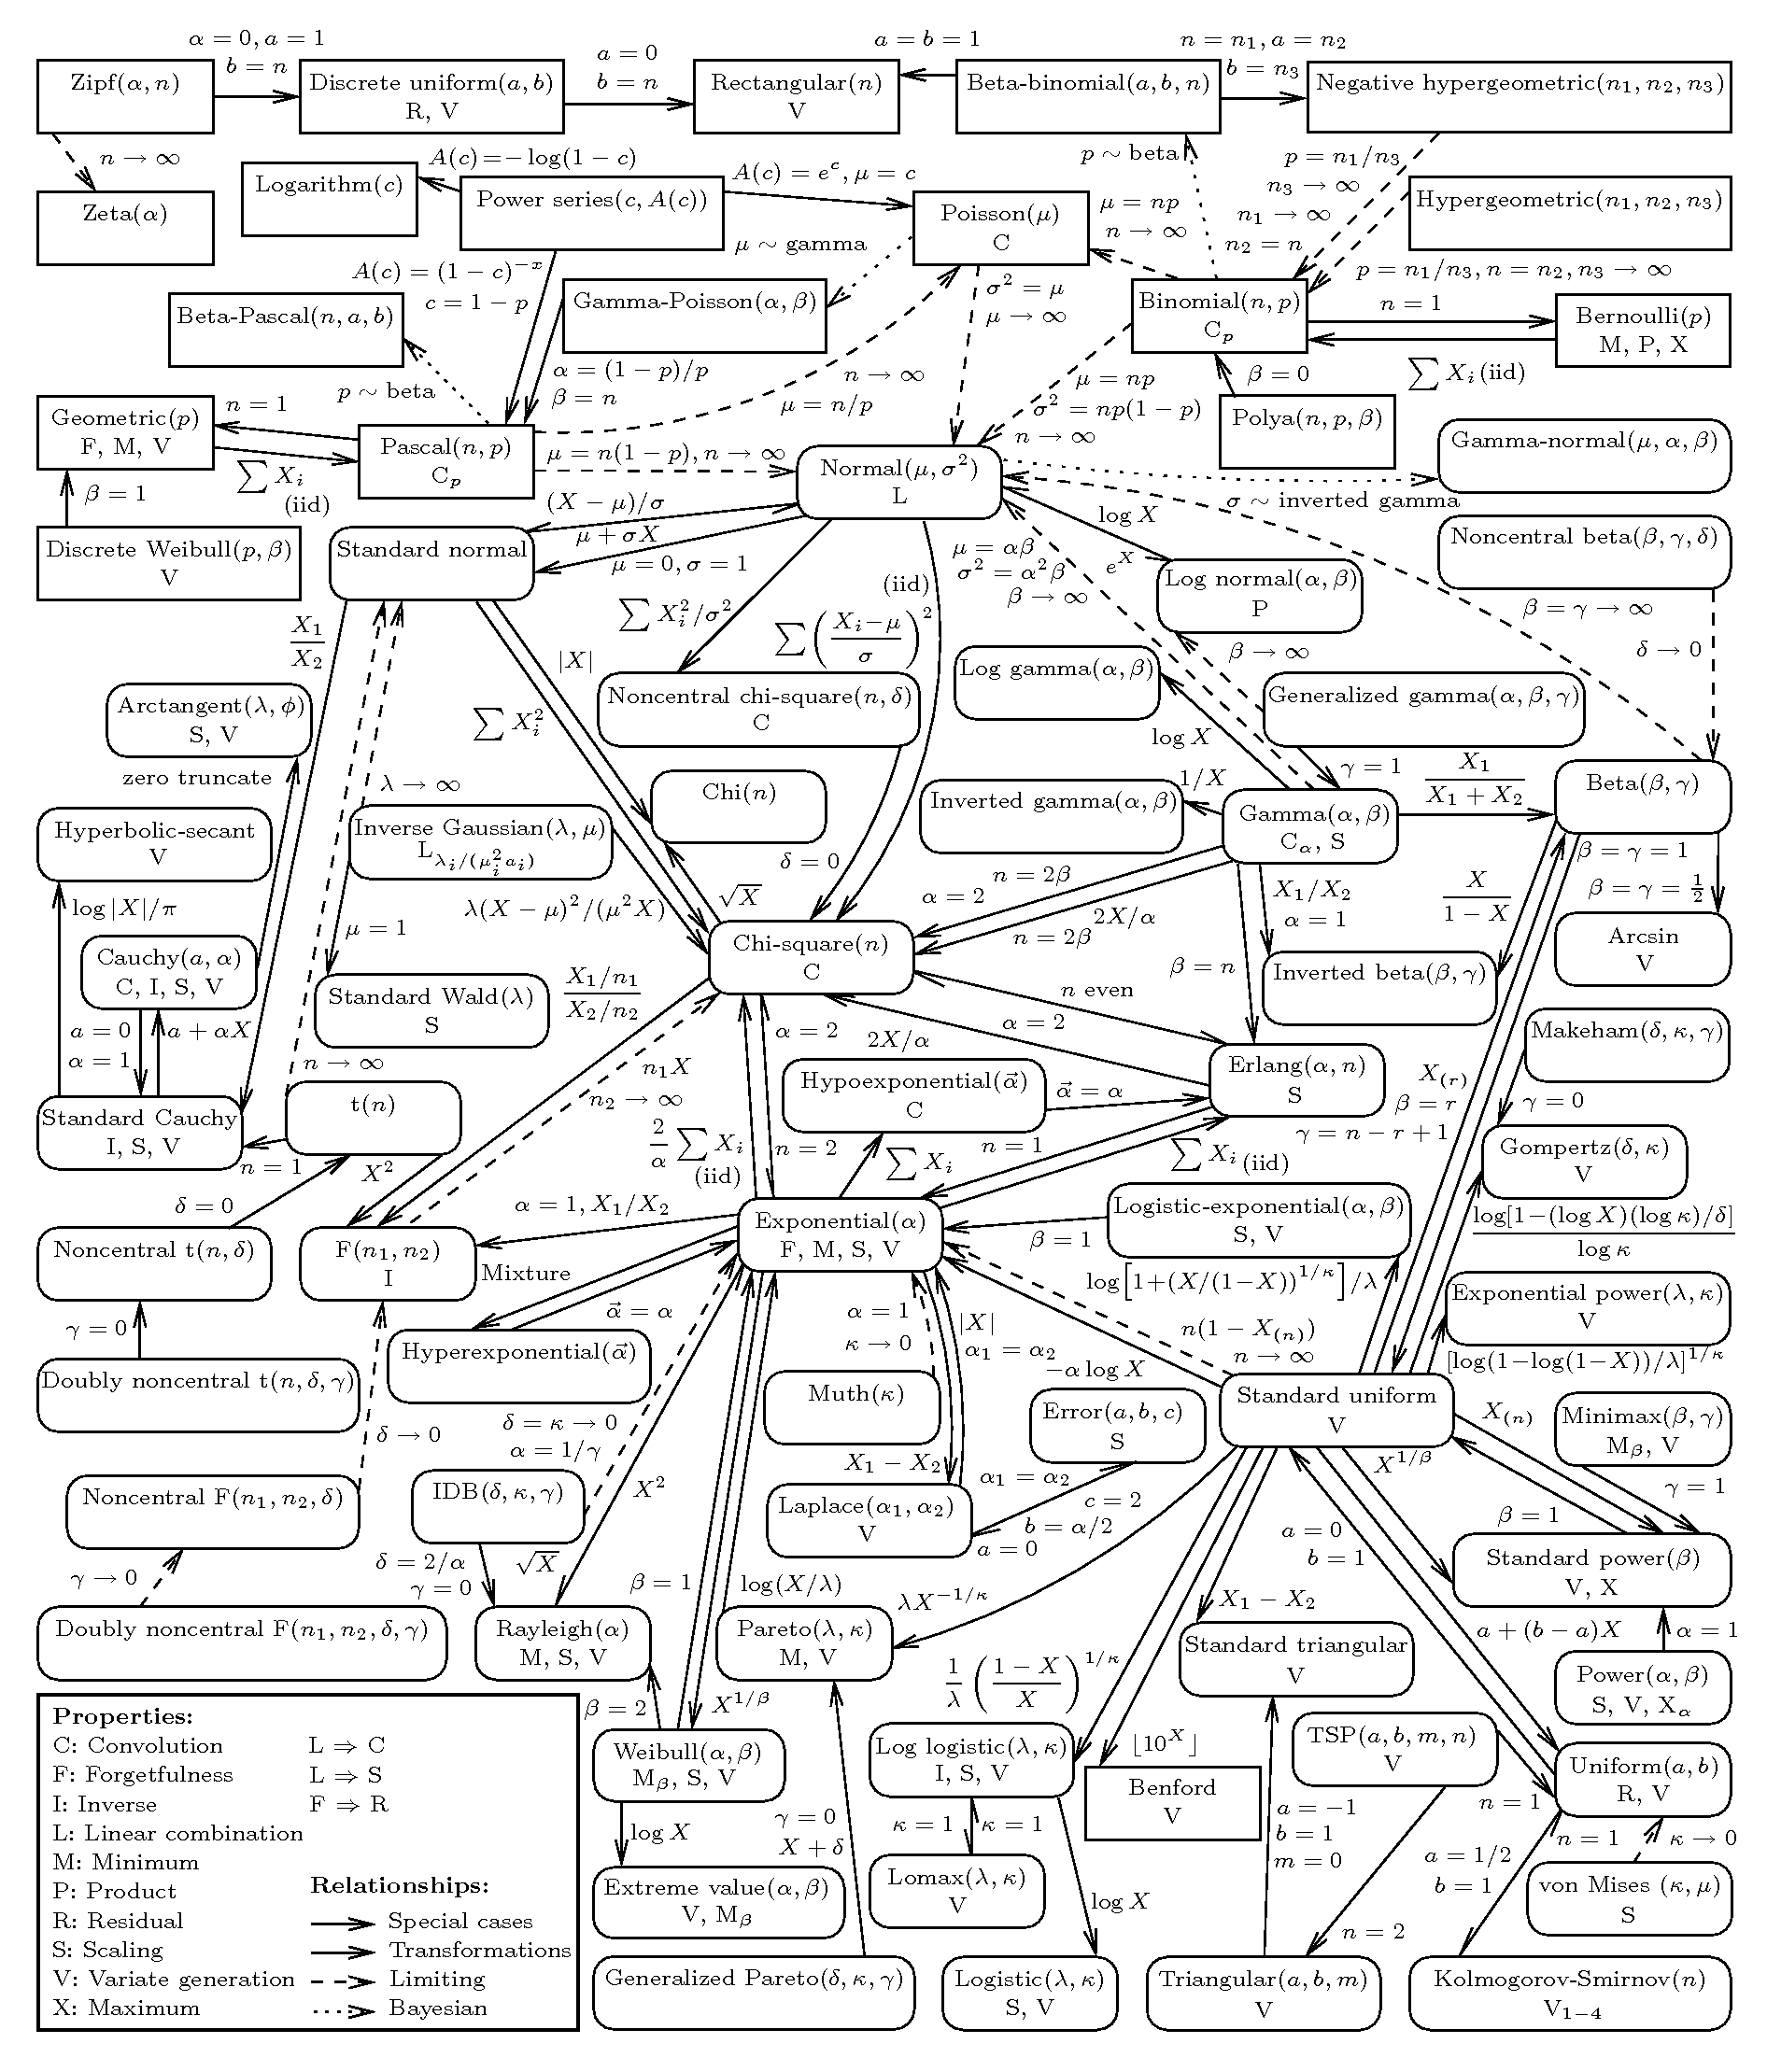
Every distribution box in the original chart is selectable. Relationship arrows retain their original mathematical labels.
Open text index →76 distributions.
Far more than 76 ideas.
The guided graph intentionally reduces visual density. Use the original Leemis–McQueston diagram below as the comprehensive reference; zoom to inspect formula labels and property marks.
Read provenance and notation →